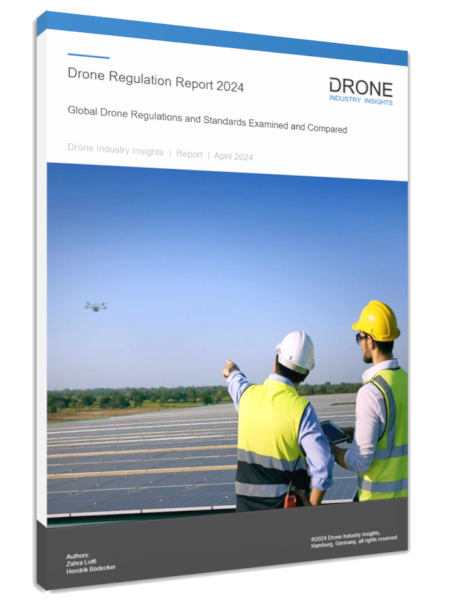
DRONEII‘s annual Drone Regulation Report provides the most comprehensive overview and analysis of global drone regulations as well as their impact on the drone industry.
Our Drone Readiness Index (DRI) is a proprietary analytical framework for comparing national drone regulations which was built based on years of experience in the commercial drone industry and an intimate understanding of the regulatory environment.
The Drone Regulation Report introduces the bureaucratic infrastructure behind drone regulations, first in Chapter 1 outlining how drone regulations are made what sorts of challenges drone regulators face. Chapter 2 delves deeper into European and international drone regulations by explaining how EASA and other EU regulatory bodies work in conjunction with national regulations for basic and advanced drone operations.
This report also features a dedicated chapter about drone certification and international standards. Chapter 3 explains how the certification process is carried out in the USA and Europe as well as an overview of the process in general and in other countries. Regarding intentional standards, the report focuses on three areas: international, basic operations, and advanced operations. The subsequent Chapter 4 then explores the rising topic of UTM regulation. This chapter explains the goals of UTM, its architecture, and its implementation status before going into the regulatory timeline and comparison between the FAA and EASA. Finally, the chapter explores international frameworks, standards, and government trials that have taken place or are ongoing.
Our Commercial Drone Regulation Report also provides country profiles for 23 of the most influential drone markets around the world. The flagship component of the report is the Drone Readiness Index (DRI), outlined in Chapter 4, which ranks countries according to the six key indicators: applicability, operational scope, human resources, administrative infrastructure, social acceptance and airspace integration.
Finally, Chapter 6 of the Drone Regulation Report provides readers with an overview of emerging drone regulation topics including outlook, challenges, and trends. Challenges are broken down between near-term, medium-term, and long-term. There is also a look at trends, which provides insights on the key factors affecting regulation as well as its converse: the key factors that regulations themselves affect.
Ultimately, this 96-page Drone Regulation Report helps companies make strategic business development decisions based on regulatory developments and forecasts. This can provide guidance into, for example, market entry or product expansion and whether it is the right time to engage in these. Droneii’s Commercial Drone Regulation Report is a also great tool for current and potential investors in the drone industry.


