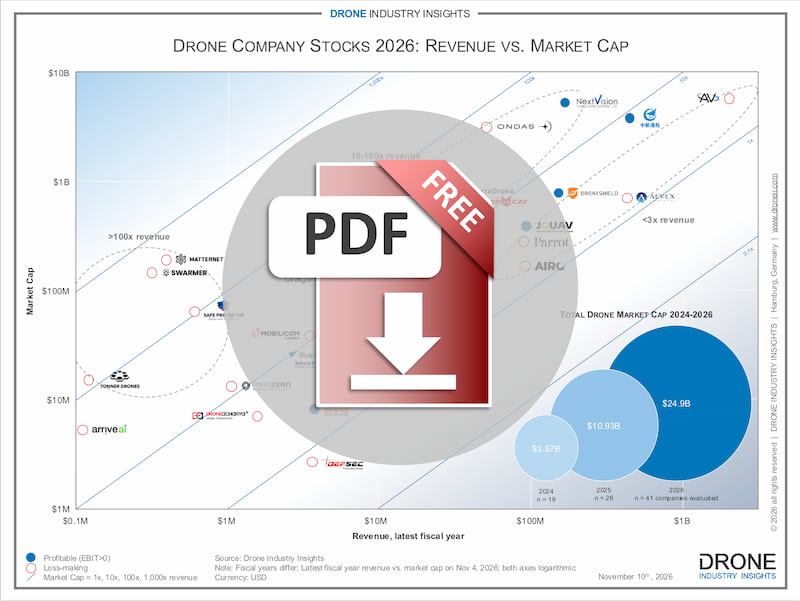
Drone Market Revenue vs. Market Cap 2026

drone market cap 2026 download icon

DESCRIPTION

The Commercial Drone Market Investments Infographic is a simple yet effective way to understand the current market dynamics in terms of funding, technology development stage and market adoption.

FREE DOWNLOAD

1 Fill in the form
2 Authenticate email
3 Get preview

I give my consent to the storage of my data in order to receive the newsletter.

ABOUT
BENEFITS

This infographic plots the market cap of listed drone companies against their revenue to show how the capital market values revenue in the drone industry

Revenue of the latest fiscal year plotted against market cap on November 4, 2026, for 37 listed drone companies, with both axes logarithmic.

Each company is marked as profitable or loss-making, based on its operating result in the latest fiscal year.

Reference lines at 1×, 10×, 100× and 1,000× revenue show each company’s price-to-sales ratio (P/S) at a glance.

Companies are grouped into three ranges: below 3×, 15–100× and above 100× revenue.

Total market cap of listed drone companies from 2024 to 2026, reaching $24.9 billion across 41 companies in 2026
All figures are converted to USD at ECB reference rates of November 4, 2026. Fiscal years differ between companies; details are given in the notes of the infographic.

Compare Companies on One Page – The infographic shows revenue, market cap and profitability of 37 listed drone companies on a single page, making it easy to compare companies of very different sizes.

Understand Valuation Levels – Reference lines at 1×, 10×, 100× and 1,000× revenue show how the capital market values revenue in the drone industry, from about 2× to more than 400×.

See Profitability at a Glance – Each company is marked as profitable or loss-making, so you can see which companies reported an operating profit and how their valuation compares with loss-making peers.

Rely on a Consistent Data Basis – All figures are converted to USD at ECB reference rates of November 4, 2026, with differences in fiscal years noted in the infographic.

Use It in Presentations and Reports – The infographic can be used in internal and external presentations and reports, with attribution to Drone Industry Insights.

If you want to learn more, read the full article here.

SAVED DATA FOR LATER

1 Content overview
2 Fill in the form
3 Authenticate email & Get preview

Cart is Empty

Thank you!

Your sign-up request was successful! Please check your email inbox to confirm.

Dear DII-Team, I would like to join the research subscription waiting list. Please contact me asap for more information.

THANK YOU!

Your sign-up request was successful! Please check your email inbox to confirm.

MY CART

There are no product in cart yet