Drone Market Map: the Drone World in an Infographic
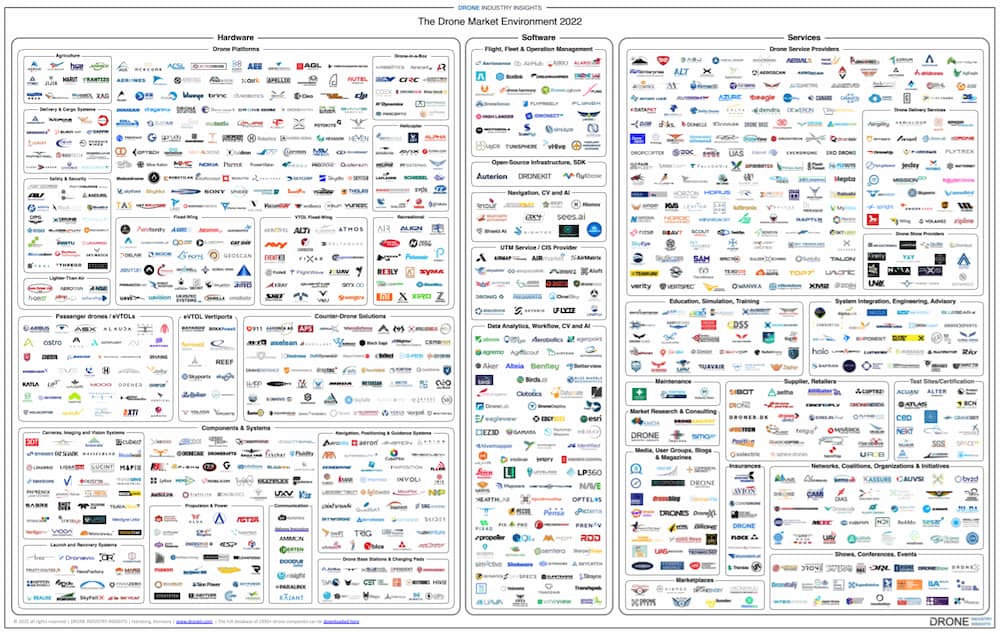
One of the most popular and highly-coveted free infographics that we offer is our Drone Market Map, and we are happy to announce a brand new version for 2022. This new edition of the market map features 1,076 drone companies, including 379 new companies that weren’t in the 2019 edition. From the outset, it is imperative to point out that these are not all the drone companies that exist in the world. It would be impossible to include all the thousands of companies that exist, and therefore the inclusion or exclusion of a particular company should not be seen as an active endorsement or disapproval of that company.
An Infographic of Drone Companies around the World
The primary purpose of the drone market map is to highlight the diversity of the global drone industry and to display some of the leading drone companies that work in various sectors of the market. However, in some cases we also decided to bring some attention to up-and-coming companies that are doing great work, so once again we do not seek to intentionally exclude many of the hundreds of well-established companies that are not currently on the map.
The companies on the map are in alphabetical order for their respective market segment, and this year we also added some new segments (e.g. vertiports and communication in hardware). Additionally, the map is complemented by our Drone Company Database, which lists all of the companies on the map as well as their location and contact information (when available).
It’s worth noting that 251 companies which appeared in the 2019 version have been removed for a variety of reasons (mergers, out of business, etc). Therefore, the total number of companies in the infographic did not increase by 379 but rather by 128. Out of the 1,076 drone companies featured, almost half are drone hardware manufacturers (49.5%). This is followed by 404 companies that are drone service providers (37.6%). Lastly, much like in the drone market itself, the smallest percentage of companies are drone software manufacturers (12.9%).
Regional Breakdown of the Drone Market Map
Where are most drone companies located? The majority of companies included in our drone market map are headquartered in Europe (40.3%) and North America (35.8%). Although Asia is the leading drone market region in the world, it is also dominated by a smaller number of companies which is why it only represents 11.6% of the companies in the drone market map.
At the country level, the United States boasts the highest number of companies in the 2022 drone market map, with a total of 337 (31.3%). This is followed by the United Kingdom (7.3%), Germany (6.6%), France (4.7%) and Switzerland (4.7%). All of these are among the top drone markets, and their vibrant economies are one reason why so many drone companies have established headquarters within their borders.
Though the number of cities is of course much more diverse, there are still some cities that stand out as hubs for drone companies. The cities that feature more than 10 companies in our drone market map are: London (25), San Francisco (20), Shenzhen (15), Tokyo (14), Zurich (12), Berlin (12), and Hamburg (12). The fact that a Chinese and a Japanese city are among the top hubs featured on the map is testament to the strength of the Asian market, even if the total number of Asian companies on the drone market map is lower than Europe and North America.
Want to Know More About the Companies featured on the Drone Market Map 2022? Check Out Our Database!
Database | The Drone Company Database 2022
• 1076 global drone companies featured
• Country, region, city for each company
• Linkedin company profiles featured
• Contact information (email and phone) when available
Leveraging the Drone Market Map and Drone Company Database
So what is the best way to leverage the information on the map and database? As we mentioned at the outset, they are not intended to give a comprehensive and holistic view of all drone companies, yet they do show how over a thousand drone companies around the world make their living. This mapping and data paint an organized picture of where these companies are and how they focus on various niche market segments that make the global industry as a whole so vibrant.
Anyone who seeks to understand the world of drones can use this infographic to understand who is out there doing what, and digging deeper into each player will shed light on their unique selling position that helps the industry move forward.
This year’s updated infographic added new markets such as vertiports, and there is no telling which unique applications will give rise to entire new market segments. With progress being made in artificial intelligence or machine learning, and with new drone regulations going into effect, companies and entrepreneurs may innovate even more revolutionary ways to apply drone technology to solve problems, so our next edition of the map may bring even more new categories and companies into the map and database.
Download our FREE Drone Market Environment Map 2022 Infographic
This infographic, “Drone Market Environment Map 2022”, which shows the logos of drone companies, organized by segment and sub-segment,

Besides his financial oversight, Hendrik is an expert in aviation law and UAV regulation with more than 10 years of experience. Not only does he consult on all regulation questions, but Hendrik also writes the yearly drone investments report. Prior to launching DRONEII, at Lufthansa Technik he was the single point of contact to Civil Aviation Authorities (CAA) of Germany, Middle East and Asia.


